It’s that point in your work where you want to create a visualization that encapsulates emotions, frustrations, joy, some juicy quotes, and all the other details of people’s experiences you’ve gathered from research. You want the experience map to show your stakeholders all the insights you’ve collected. Let me be your cheerysome silver-tongued persuader to push on the boundaries of your familiar mapping visualizations!
Service designers visualize the intangible—such as the service experience, with its systems and complexity. Storytelling is an invaluable tool to help stakeholders understand and take intentional action. We use experience maps to visualize an end-to-end service experience to help our stakeholders and collaborators better understand functional, social, and emotional needs.
One of my biggest frustrations is how these visualizations become oversimplified to fit in a table because of skills, technical constraints, lack of time, or just the over-reliance on the land of Microsoft Office Suite to develop an essential piece of visual storytelling. These boxy visualizations might even be expected in your organization, but do your stakeholders ever read them? Do they follow up with thoughtful questions and recognize their critical insights? I get it—tabular data is foundational to business, development, and finance. If you haven’t been dazzled by the hypnotic force of Excel TikTok, you now know what to watch when you have your next bout of insomnia. But let’s not put our stakeholders to sleep. Boxy visualizations don’t do the human experience justice nor inspire action or curiosity in the same way visual storytelling has the power to do. Read on to learn how to get your audience’s attention through visual storytelling!

Harmonic’s definitions of an experience map:
An experience map is a visualization of the end-to-end experience of one or more customers, often about a specific customer journey (e.g., purchasing a car). Experience maps communicate the range of variations of needs and experiences, and are informed by research. They highlight opportunities to create a more seamless, unified end-to-end experience. They communicate the range of what people do, think, and feel and the touchpoints and channels they interact with across time. They may include other experience-building blocks: relationships, places, moments, and other actors.
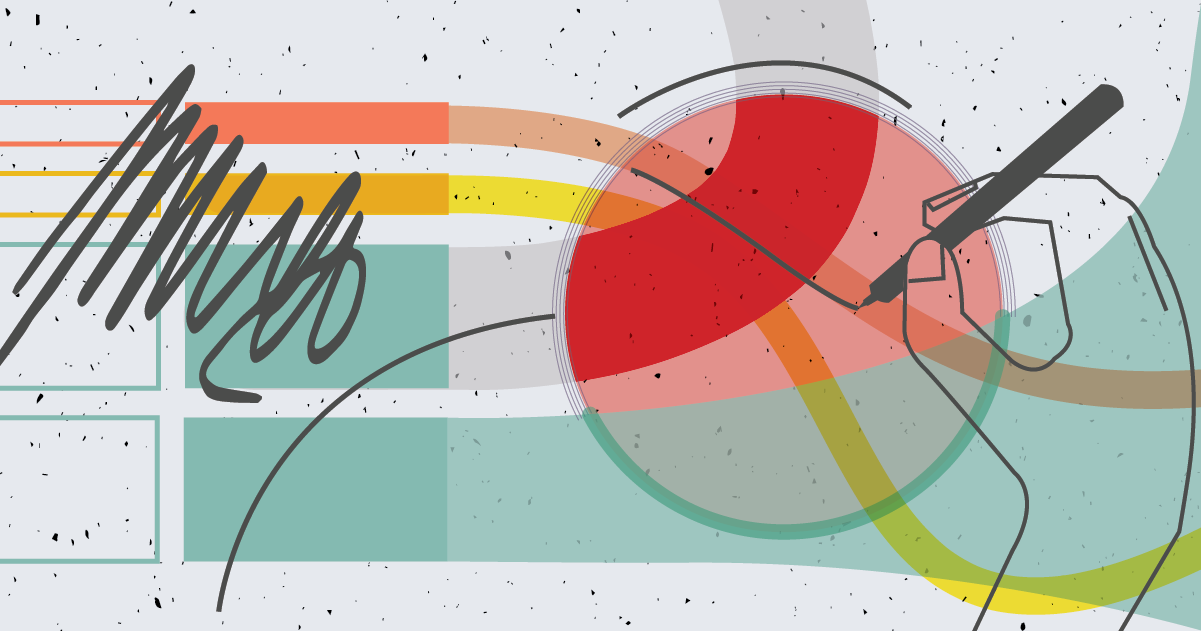
Use case: the seismic frustration scale of a help center
Here is a bold example of an experience map we did for a client inspired by scientific illustrations of the convulsing layers of Earth’s lithosphere during an earthquake. After participating in the research, it seemed fitting! This experience map visualizes the two experiences in an organization’s internal help center—those giving and receiving help. Both sides expressed annoyance, frustration, and irritation, so we only mapped negative emotions. The visual language is sharp and shows the magma-like layers of frustration. It has the right level of detail for people to “read it” from 10 feet away, drawing them in to gather the details. It’s not shy. It demonstrates the story of a volatile experience, and it communicates the nuance and insights of the story.

Drawing from Candyland to Quantum Concepts: Unveiling the Kaleidoscope of Inspiration
Inspiration is all around, but while I do often look out my window at my pigeon friends for an aha moment, I’m also on a deadline, so here are some of my favorite sources of inspiration from psychology, visual design, physics, and board games that I like to recall when I am ready to rethink the form of the experience.
For inspiration, I love looking at the work of Federica Fragapane, one of my favorite data visualization designers. Her work is lyrical and distinctive, presenting narratives at different zoom levels while retaining overall visual consistency. They communicate complexity with constraints; you might not need to know Italian to understand them. Her novel and beautiful visualizations inspire me to create dynamic new shapes, and I hope they inspire you, too.

Another source of form inspiration is board games! The Candy Land board game has a curvy line with points where you move backward or forward, with twists and turns and obstacles. Candyland isn’t a game of skill, which can be a parallel to being at the mercy of an experience’s parameters. The board’s layout resembles many experience patterns—like stages in the journey, loops in the experience, and having to start over.

Tap into your inner Nolan: experiment with visualizing time
We have many well-honed models to work from when visualizing time—the watch, calendar, timeline, the Marvel multi-verse, and any Christopher Nolan movie. Visualizing time needs to push on the left-to-right timeline. But before I go down the rabbit hole of relativity, black holes, and quantum mechanics, I’ll recall a recent use case from my work.
In a recent project, we researched the experiences of people undergoing an unexpected and stressful event. Our in-depth conversations included visually mapping their experience in real-time, including how various service providers tried to support them. When we use this research method to plot their experience, people rarely remember the linear order of events. More stressful or traumatic events—like the one we were studying—result in even more disjointed recollections. People often talk about how time shortens or lengthens; they don’t remember pivotal moments or recall things in order. Some parts of their experience might be hyper-detailed, while others are non-consequential. A left-to-right cell parade can’t tell that story, so put on a Nolan flick and think of new ways to visualize time and do justice to the insights and stories you’re expressing. I hope to experiment with this soon, but below are a few examples of interesting visualizations using time.

For instance, time (e.g., seasons, hours) and experiences (paying a bill, renting jeans) can be cyclical. Some visualizations show this by representing time in arcs, spirals, and wedges. Experience maps are more flexible than a large data set visualization, so there’s room for storytelling to give these expressions some shape.


Figure 1: Two visualizations of sunshine intensity using about the same screen real estate and the same color coding scheme. In the spiral visualization it is much easier to compare days, to spot cloudy time periods, or to see events like sunrise and sunset. Weber, M., Alexa, M., & Müller, W. (2001, October). Visualizing time-series on spirals. In Infovis (Vol. 1, pp. 7-14). Copyright 2001 by IEEE.
The color and the shape
When facilitating design research, we refer our interview participants to the “wheel of feel.” If you’ve ever answered a guest survey request, you may recognize that your emotions don’t neatly fit into a scale of 1 to 5. This silly-named emotional identifier allows us to understand and anchor the complexity and scale of the experience as we conduct our research.

As we work to understand the breadth and depth of emotions of the experience, we also seek ways to demonstrate that through visualization. There is a rich research library on the meaning of color and shape. What does anger look like? Is it pointy, aggressive, and most likely red? Red can be associated with warning and danger since it is blood and fire color. One of my favorite visualizations that captures emotions is the Atlas of Emotions. The anger is red and spikey, and the blue is fuzzy and blobby. Pixar’s Inside Out uses a similar language to depict their characters—Joy, Fear, Sadness, Anger, and Disgust. If these artifacts look similar, the psychologist Paul Eckman consulted on both projects.

Crafting compelling narratives for deeper insights
Experience maps are a fascinating visualization artifact and a powerful storytelling tool. And, like most good stories, you must test and adjust how and what you say. Visualization tools are indispensable for weaving a compelling narrative. The tendency to oversimplify these representations to fit in a grid can bore your audience, muddle your insights, and fail to create necessary buy-in to your cause.
Breaking free from the boxy constraints of tables and templates opens up new possibilities to capture and communicate the richness of the service experience. It empowers designers to delve deeper, pose more meaningful questions, and inspire our clients, collaborators, and stakeholders to take meaningful action to improve their services and the lives of employees and customers.
References
Brumfiel, G. (2022, December 16). Researchers say time is an illusion. So why are we all obsessed with it? Retrieved from npr.org on January 12, 2024.
Frangapane, Federica. Retrieved January 12, 2024, from behance.
Kiener, M. (2015). Why Time Flies [Photograph]. Maximiliankiener.com.
Kuniecki, M., Pilarczyk, J., & Wichary, S. (2015). The color red attracts attention in an emotional context. An ERP study. Frontiers in human neuroscience, 9, 212.
Elf 1735, M. (2011). Robert Plutchik’s Wheel of Emotions. [Photograph]. Wikipedia.
Mitchell, Z. (2018, July 13). Candy Land..pbs.org. Retrieved January 25, 2024, from pbs.org.
Randall, K. (2016, May 6). Inner Peace? The Dalai Lama Made a Website for That. www.nytimes.com. Retrieved January 25, 2024, from nytimes.com.
Roper, C. (2015, June 19). How Pixar Picked the 5 Core Emotions of Inside Out’s Star. Wired.com. Retrieved January 12, 2024, from wired.com.
Weber, M., Alexa, M., & Müller, W. (2001, October). Visualizing time-series on spirals. In Infovis (Vol. 1, pp. 7-14).